|
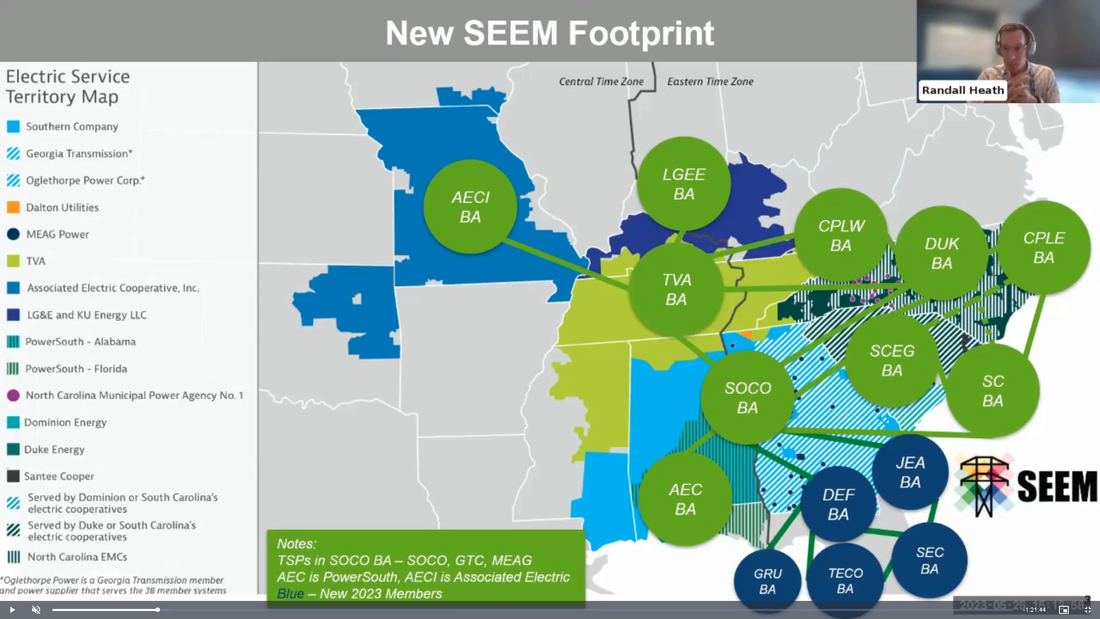
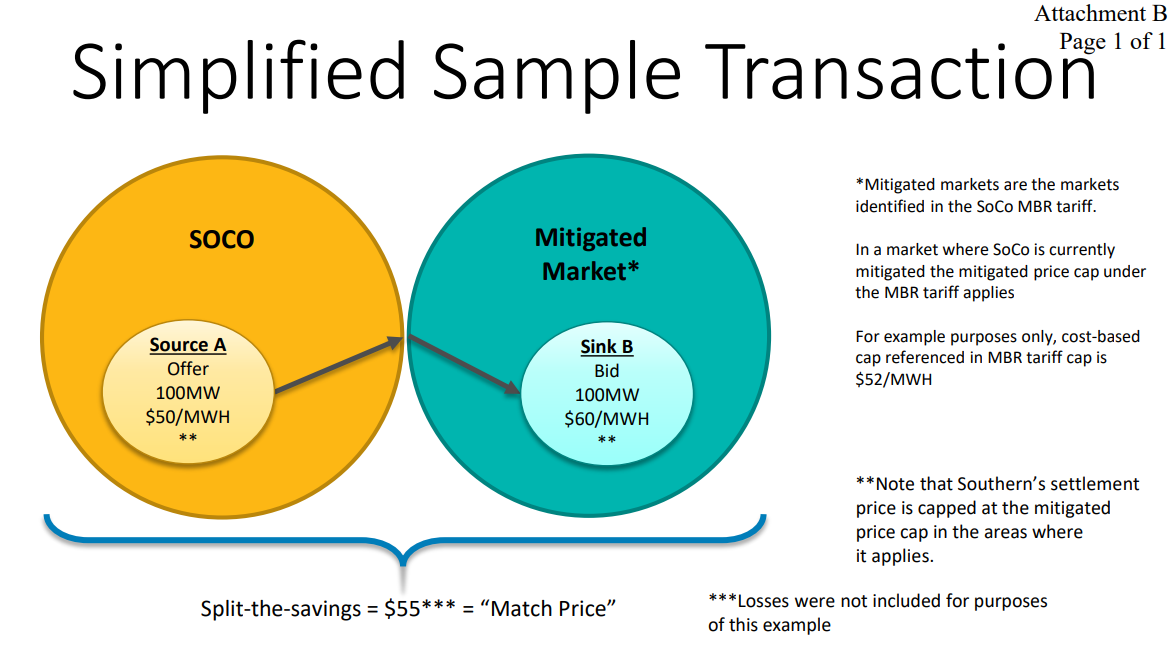
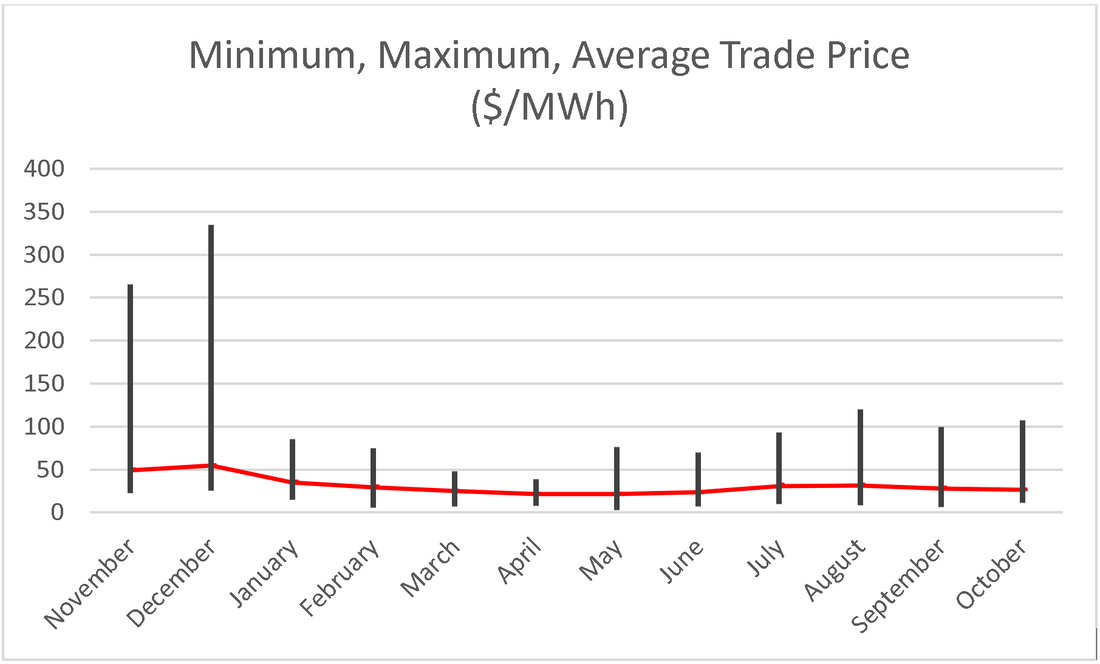
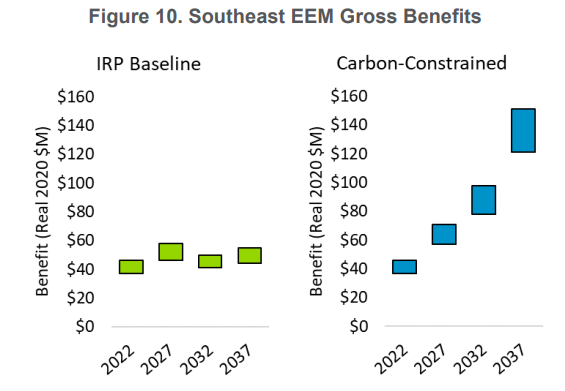
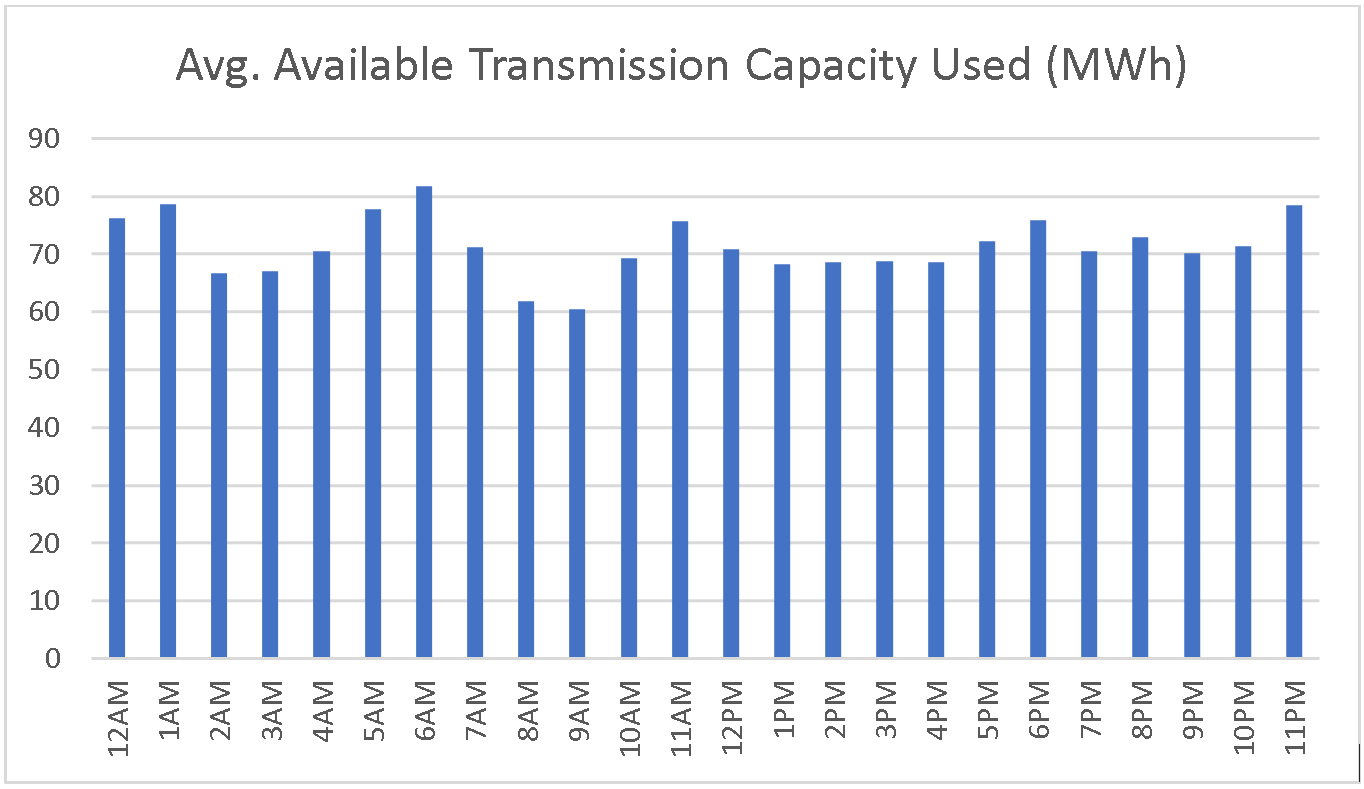
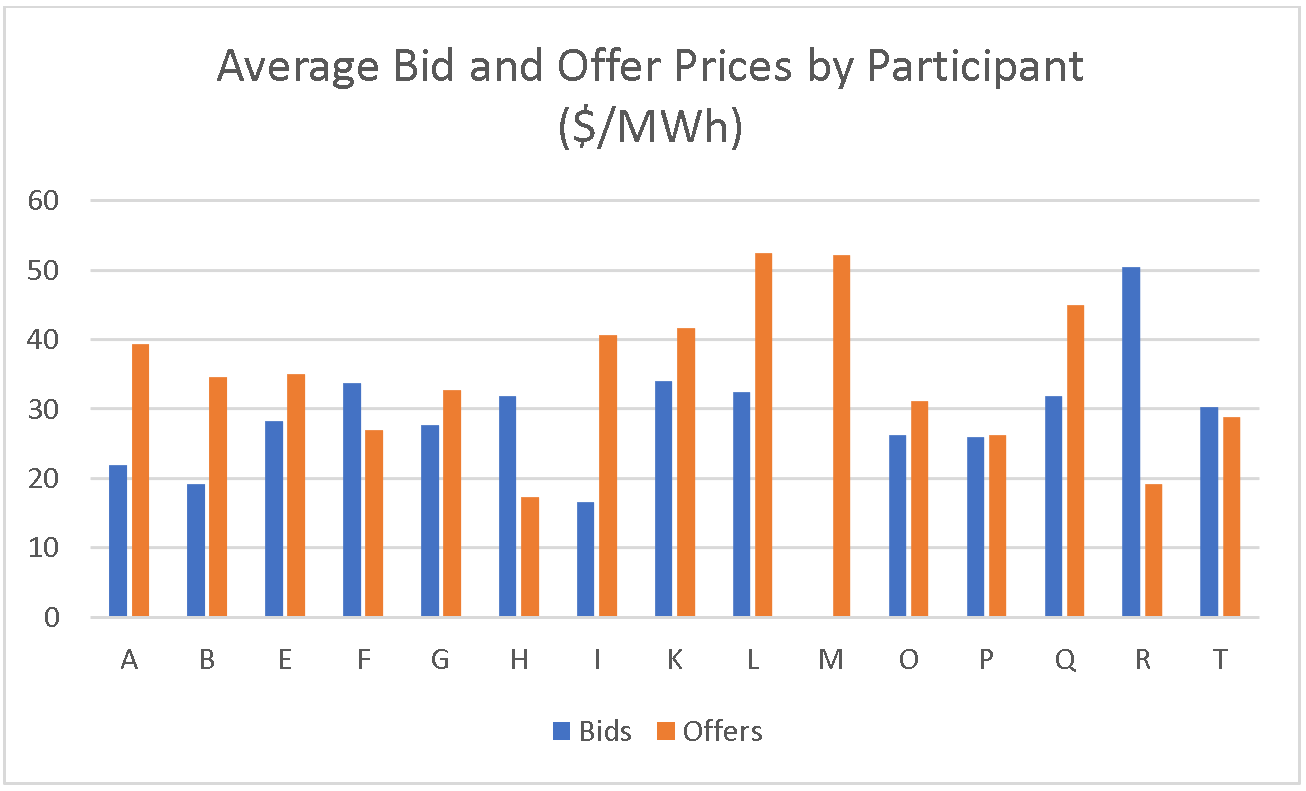
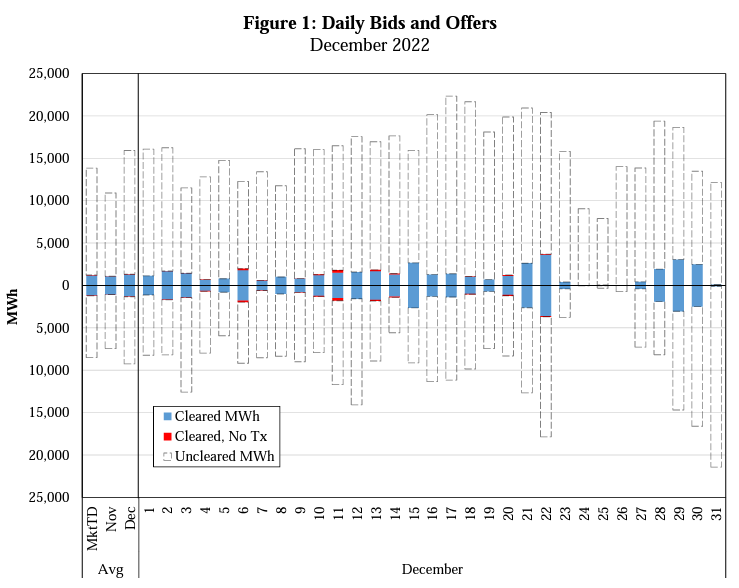
The Southeastern Energy Exchange Market (SEEM) began public operations on November 9, 2022. SEEM utilities touted it as an “Advanced Bilateral Market Platform” fit for the 21st Century. An early press release stated, “The result will be cost savings while improving the integration of all energy resources, including renewables, which are expanding rapidly in the Southeast, leading to a cleaner, greener, more robust electricity system.” Fans of broader regional market reforms, and opponents to SEEM, called the platform a “nothing burger” noting its paltry benefits. Over the past twelve months, SEEM utilities and opponents have been waiting to see if this experiment is a success or a failure. After a year’s worth of data and operations, it is fair to say that SEEM has not lived up to any of its promises. A Small, Simple Market SEEM participants describe the platform as a simpler, easier, cheaper way to enable power flows across the southeast. Duke Energy and Southern Company have been two lead proponents of the market design. Testimony and analysis filed by the SEEM utilities at the Federal Energy Regulatory Commission (FERC) suggested utilities could save about $45 million annually with SEEM, or about $2/MWh of power traded. That is the same as just $0.002 per kilowatt hour (kWh) of electricity savings. For comparison, the Midcontinent Independent System Operator (a competing market structure) estimates it saved its members over $4 billion in 2022 alone, or nearly 100x more than SEEM was estimated to save. The premise is this: utilities would voluntarily offer extra energy on free transmission for a voluntary price, and if there is a voluntary buyer willing to pay a higher price, those two utilities would “match” and split the savings. SEEM participants provided this example: Southern Company wants to sell 100 megawatts (MW) of power for $50 per megawatt hour (MWh), and if a buyer is willing to purchase at $60/MWh, the two would split the price at $55/MWh and both end up better off than they would have been without the transaction. Below is an example of this sort of power trade. This past year, very little power has been traded using SEEM. In total, 616,398 MWh of power were bought and sold over a twelve-month period. If an average home uses about 12,000 kilowatt hours (12 MWh) per year, the power traded on SEEM equates to about 51,000 homes. For comparison, a large-scale solar facility (300 megawatts) provides enough power for about 55,000 homes per year. Average power prices on SEEM were about $30/MWh, with minimum prices reaching $2.85/MWh in May 2023, and maximum power prices reaching $334.66/MWh in December 2022. A Failed Market SEEM participants touted economic savings by engaging in this new platform. Testimony filed at the Federal Energy Regulatory Commission pegged gross benefits of $47 million annually, with an initial startup cost of $3.8 million, and annual operational costs of about $2.8 million. In a region with over 50 million people, SEEM was projected to save less than $1 per person per year. This past year’s operation has fallen well short of expectations and SEEM may not have saved any money this past year. SEEM does provide some data publicly, but transparency is lacking. Buried deep in the SEEM public data is cell Z4 of the Public Monthly Informational Report spreadsheet, listing a “Total Benefit” value. There are no units, nor further description in any of the monthly Independent Market Auditor reports of what this value fully entails. However, this value likely represents the gross benefits created in the region for each month, given that gross benefits (as opposed to net benefits) are how SEEM’s value was described to FERC. The aggregated Total Benefits for the past year add up to $3.3 million—93% lower than the projected $47 million. If SEEM’s first year costs were $6.6 million ($3.8 million in startup costs, plus $2.8 million in operational costs, as estimated to FERC), and its gross savings were just $3.3 million, SEEM has cost southeastern ratepayers more than it has saved. Without full cost and benefit transparency from the SEEM utilities, these sorts of comparisons will remain difficult. In October 2023, the SEEM Board of Directors met and received an update from the Independent Market Auditor, Bob Sinclair of Potomac Economics. Three items of interest were included. First, “Large percentage of bids and offers are too far apart to clear.” Put another way: utilities are not submitting bids high enough, or offers low enough, for trades to occur. This is an unsurprising outcome, given that each bid and offer is entirely voluntary and not directly tied to specific generation. Next, “To match more efficiently bids need to come up and offers need to come down.” In other words: utilities are stingy when buying and tight-fisted when selling. Finally, “Clearing prices have strong correlation to gas market prices.” Solar is not a price driver. Gas is. The Auditor’s report notes that “The market is not highly liquid”. And “SEEM receives a substantial volume of uneconomic bids and offers that are unlikely to clear.” If the market is not functioning properly, the benefits that were described to FERC in SEEM’s original filings (and hoped for by participating utilities) as justification for the new market evaporate. SEEM is not operating as expected. A Dirty Market When SEEM participants filed their application at FERC, renewable energy was a top selling point. In the testimony provided, analysts stated, “It should be noted that the Southeast EEM can help participants manage periods of excess energy and high net demand ramping created by renewable integration.” SEEM utilities worked hard publicly to support SEEM as a valuable market for solar power generation, even stating, “The SEEM reduces carbon emissions and supports renewable energy integration…” In an alternative market structure like an RTO, power bought and sold is tied to specific generation resources, so buyers can determine exactly the type of resources being purchased. Not so in SEEM: power prices are totally separated from generation type, making it impossible to determine the exact resource mix being traded, or impact on emissions. It was important for SEEM’s branding, at least publicly, to appear to help solar power and reduce emissions. The reality is, of the few trades that have occurred on SEEM, SEEM has mostly been used at night, when solar power is unavailable. Data available on the SEEM website includes Public Hourly Available Transmission Capacity (ATC) Usage. Those data can be used to determine trade quantities and hours. It can also be used to determine which utilities are using the most ATC. Put another way, ATC is a way to measure which utilities are providing their transmission (for free) for electrons to zip across the region. ATC data cannot be used to determine buyers and sellers, nor can it determine generation type. During the night (7PM-7AM), the average Available Transmission Capacity used in each quarter hour was higher than the average used during daylight others (7AM-7PM). The top three hours of average transmission usage were 6AM, 1AM, and 11PM. The bottom three hours of average transmission usage includes 9AM and 8AM. SEEM’s generation mix at night is mostly coal, natural gas, and nuclear power—not solar power. There also appears to be no carbon emission accounting associated with SEEM, meaning the reduction in carbon emissions and support for renewable energy is without supporting data. A Dysfunctional Market Based on the available data, some interesting market strategies appear. For instance, Participant O tends to keep its bids and offers around 10 MWh. Participant E prefers bigger slugs of power: 35 MWh for both bids and offers. Participant T keeps their bids and offers around the 1-2 MWh range. While the quantities are interesting, the pricing tactics are wild. Normal market operations suggest utilities would desire to buy low and sell high, or prices would be close to actual costs. That’s not always the case with SEEM. Participant O’s average bid purchase prices are often around $26/MWh and sale offer prices are around $31/MWh; a fairly tight window of low bids and high offers. Participants F, H, R, and T, on average, are bidding high and sell offers low. This may be an indicator those utilities are relying on SEEM as a market of last resort—as opposed to ramping down generation, sell low, and as opposed to buying longer term contracts, buy high. The stingiest utilities (the ones willing to pay the least for purchases) are Participant I (with an average bid of just $16.5/MWh), Participant B ($19.2/MWh), and Participant A ($22/MWh). If those participants are rational, those utilities must believe that their avoided costs are at least that low, and their generation units are more efficient than every other market participant. They are not seriously interested in buying power. One would expect these utilities to also set the lowest prices for offers, to out-compete their neighbors. But the opposite seems true: Participants I and B offer power for sale at a significant premium compared to their bid prices ($42/MWh and $35/MWh, respectively). The high rollers are Participant R (with an average bid of $50.4/MWh), and Participants K and F (both around $34/MWh). A rational utility that bids high prices is likely very interested in purchasing power and will want to ensure the market makes a match. That may be because their existing generation fleet is relatively expensive, or scarce. One would expect a rational utility to create offers that are close in price to their existing generation (high bids, high offers). Strangely, Participants F and R have their average offers at a significantly lower level than their average bids—they plan to sell very low and buy very high. Participant R on average offers power to be sold at $19/MWh, but average bids for purchase are $50.4/MWh. Meanwhile, Participant M only wants to sell power at an average of $52/MWh, and never put in a bid to buy power. In the study submitted to FERC to support SEEM’s formation, one of the underlying assumptions is that “The study assumes that participants are submitting bids and offers at true costs. The impact of more complex bidding strategies was not accessed [sic].” The actual operational data suggests that utilities are not relying on their true costs to form bids and offers. A Desperate Market Perhaps there are temporal considerations at play—market participants could simply be withholding their bids and offers until a voluntary time that, based on some internal company belief or strategy, provides a value to their companies. During Winter Storm Elliott, when the only utilities in the nation to experience blackouts and rolling load shedding events were SEEM members, SEEM did not help. The Independent Market Auditor’s report from December 2022 showed that from December 24-26, no “matches” (trades) occurred. Offers (sales) almost entirely evaporated. That might not be terribly unusual: the region was struggling to provide power, so few utilities inside the SEEM footprint had “spare” energy to sell neighbors. Outside the SEEM market, MISO helped bail out the southeast by pumping gigawatts of power into the south. The truly bewildering outcome of Winter Storm Elliott was that the total SEEM bids (utilities with the desire to purchase power), plummeted. In a stressed power market, with presumably high-power prices, you would expect the market participants to increase their willingness to buy, and to increase both bid prices and bid quantities submitted. The opposite occurred. SEEM was not useful during Winter Storm Elliott, and the market participants appear to have abandoned it in the most extreme time. Participant O made 77% of the bids from December 24-25. The next most active participant during the storm was Participant G, with just 10% of bids submitted. Participants E, I, and L stopped participating entirely: no bids, no offers. Participant O also submitted the highest bid price of all time for SEEM during Winter Storm Elliott: $4,354.75/MWh. These prices were submitted as a bid at 11AM on December 24, 2022. The next highest bid prices were just $1,175/MWh by Participant K, around the same time. Clearly both of those utilities felt a strong need to boost their bid prices in the hopes of finding spare megawatts. In one aspect, the SEEM utilities determined it was cheaper for the lights to go off than bid higher prices and attract supplies (in the industry, this may be considered a soft version of a Value of Lost Load). No purchases nor sales were made on SEEM on December 24th, despite the high prices and the region’s rolling blackouts. Around that same lunchtime hour, solar power in the region was performing exceptionally well. Bid prices are rarely high in the SEEM market, and similarly bids are rarely below zero. Only Participant A submitted a handful of negative bids this past year, and all in late April 2023. Given that no offers were ever made at a negative price, it is likely impossible these orders ever matched (bid prices must always be higher than offer prices). The lowest offer price was submitted by Participant H: $1/MWh for sale in both February and May 2023 for about 13 MWh to 25MWh at a time. When a utility offers power for nearly free prices in SEEM (or, even below operational costs), it is unclear how its ratepayers are impacted. These costs are obscured in utility rate cases with little to no transparency. A Discriminatory Market Some spectators have noted SEEM appears to be an elaborate public relations effort to discourage real market reform in the southeast, like developing an energy imbalance market (EIM) or a fully developed regional transmission organization (RTO). With minimal benefits, restricted governance, lackluster transparency, and no planning components, SEEM lacks many of the same attributes of a developed market. There is also no venue for state regulatory agencies (Public Service Commissions) to participate in SEEM, unlike RTOs where state regulatory involvement is guaranteed. On July 14, 2023, the DC Court of Appeal s released a decision regarding SEEM: the market is discriminatory. “The creation of a new service that—by its design—excludes existing market participants evokes the discriminatory practices against third party competitors by monopoly utilities that prompted the Commission’s adoption of Order No. 888,” the court said. The Federal Energy Regulatory Commission (FERC) is now required to reinvestigate the value of SEEM and determine if it is “…actually superior to the status quo in light of Order No. 888’s open access principles.” FERC has not acted on the remand order, yet. The future of SEEM is in limbo. The Path Forward Multiple studies have found that the southeast could benefit from broader market reform, like an energy imbalance market (EIM) or a regional transmission organization (RTO). These common-sense market reforms are operational throughout the United States. EIM’s and RTO’s are tried and tested market structures that rely less on highly speculative model results to create benefits. Alternatively, SEEM’s entire foundation was built on an assumption that participants would be active and rational; neither has proven to be true. During Winter Storm Elliott, the southeast relied heavily on neighboring RTOs to help keep our systems afloat. Each year that the southeast waits to determine whether SEEM might live up to its promises is another year of millions of dollars in lost benefits. It is time our state regulators take the reins on SEEM, investigate its operations, and plan for a better system. AuthorSimon Mahan is the Executive Director of the Southern Renewable Energy Association.
0 Comments
Leave a Reply. |
Archives
July 2024
Categories |

 RSS Feed